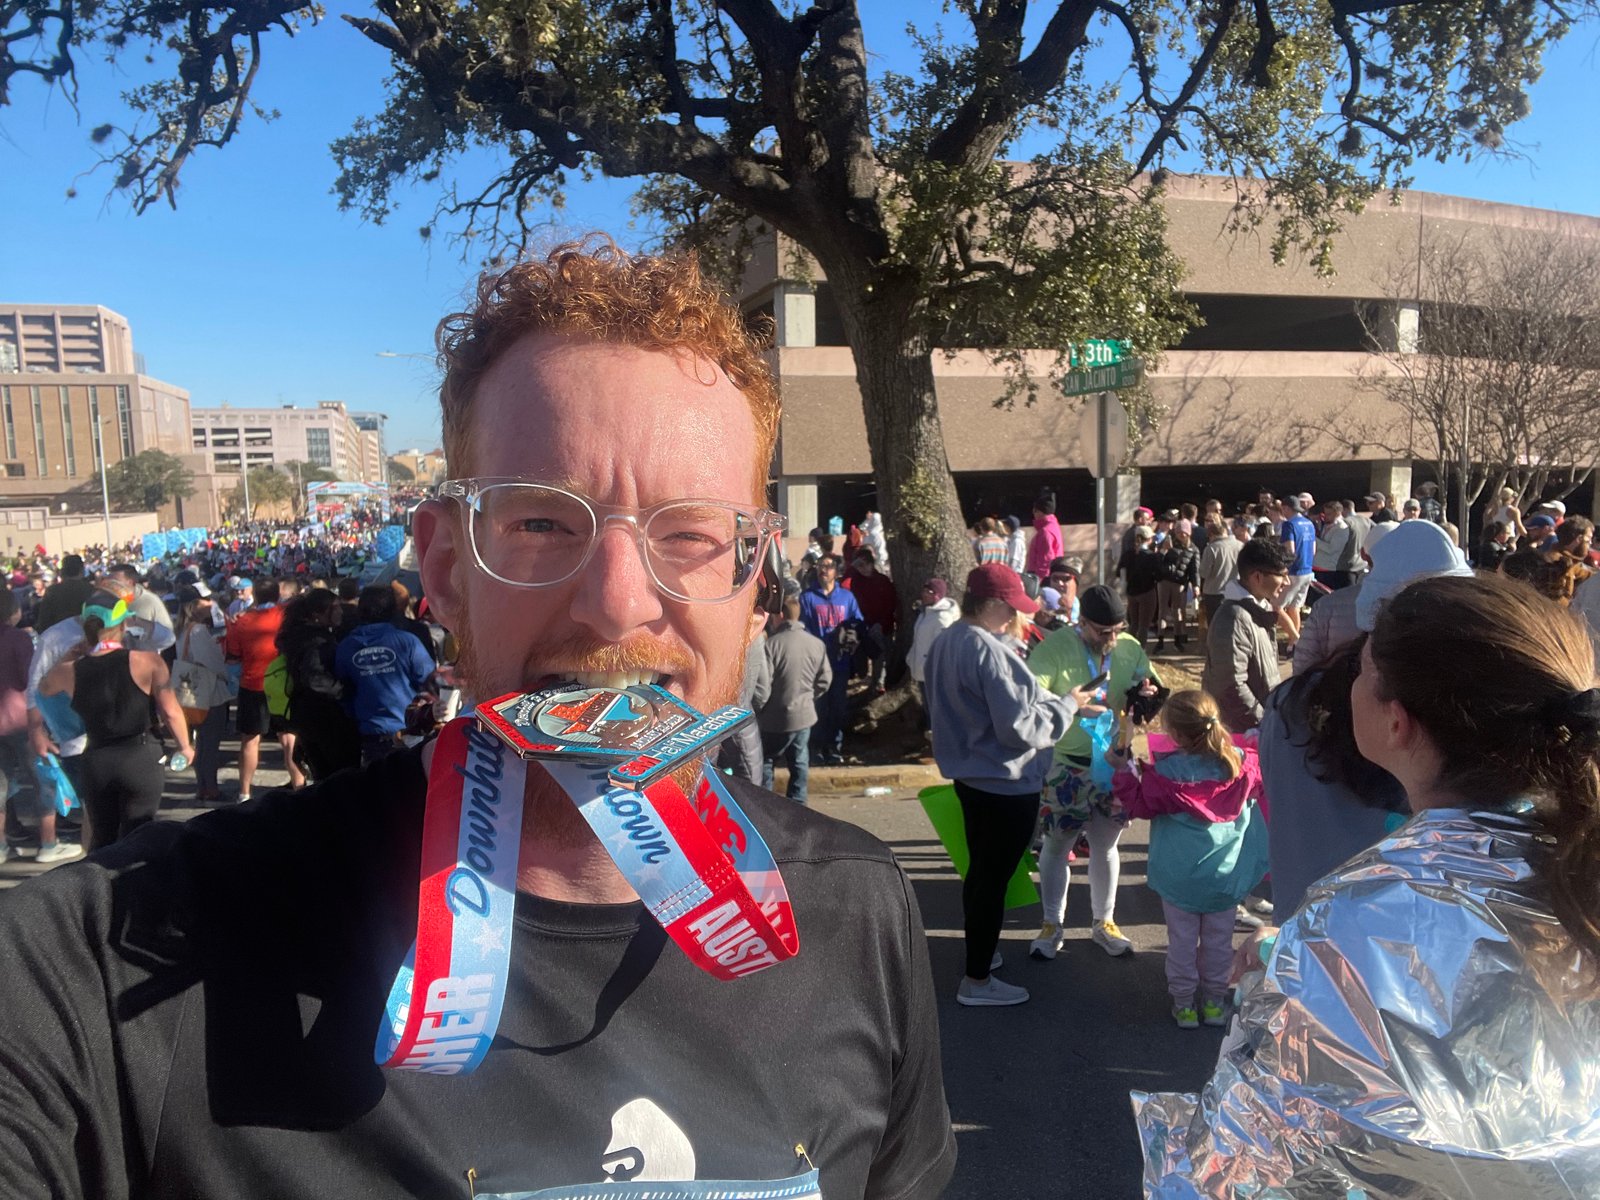
I'm John, and I've been building my running app for about two years now. As an outdoor runner in Texas, I wanted to have a better understanding of at what point I would get a sunburn. If you look at my pic you'll see why. 😉
I struggled to find anything that would tell me with any certainty how long I could run without getting burned. So that's what I worked on first.
Starting with sunburn
Using UV index to understand when a user gets burned is a thorny problem. You need to understand the skin type of the user, if they've applied sunblock, when they applied it, if they're sweating or swimming, or if they're near snow — which can reflect up to ~90% UV back at you.[1]
I've simplified this for the app to users who haven't applied sunblock at all. I assume no snow and take skin type as an input to give better, personalized recommendations.
Then came heat
Then I started working on heat exhaustion — because Texas.
Heat exhaustion and heat stroke is even tougher. I've done more research on this area than any other weather function, and I think for good reason. Heat-related illnesses represent the leading cause of weather-related deaths and hospitalizations.
Some factors you might not think of: your heat acclimatization, work output, body composition, and clothing all play significant roles. Fun fact: acclimatization roughly equates to higher sweat output — an acclimatized runner can sweat earlier, more efficiently, and at a higher sustained rate.[2]
The key metric any modern scientific recommendation involves is called Wet Bulb Globe Temperature (WBGT) — a measure of environmental heat as it affects humans. Unlike a simple thermometer reading, it accounts for all four major environmental heat factors: air temperature, humidity, radiant heat from sunlight, and wind. It's hard to calculate and expensive to access via API — roughly 15–20× what I'm spending now for the standard data pull.
I'm able to approximate WBGT from standard weather data and some clever estimation, aligned with the ACSM framework. For the UI, I assume an unacclimatized user wearing light clothing at moderate intensity — a reasonable default that keeps things simple.[3]
The four hazards, at a glance
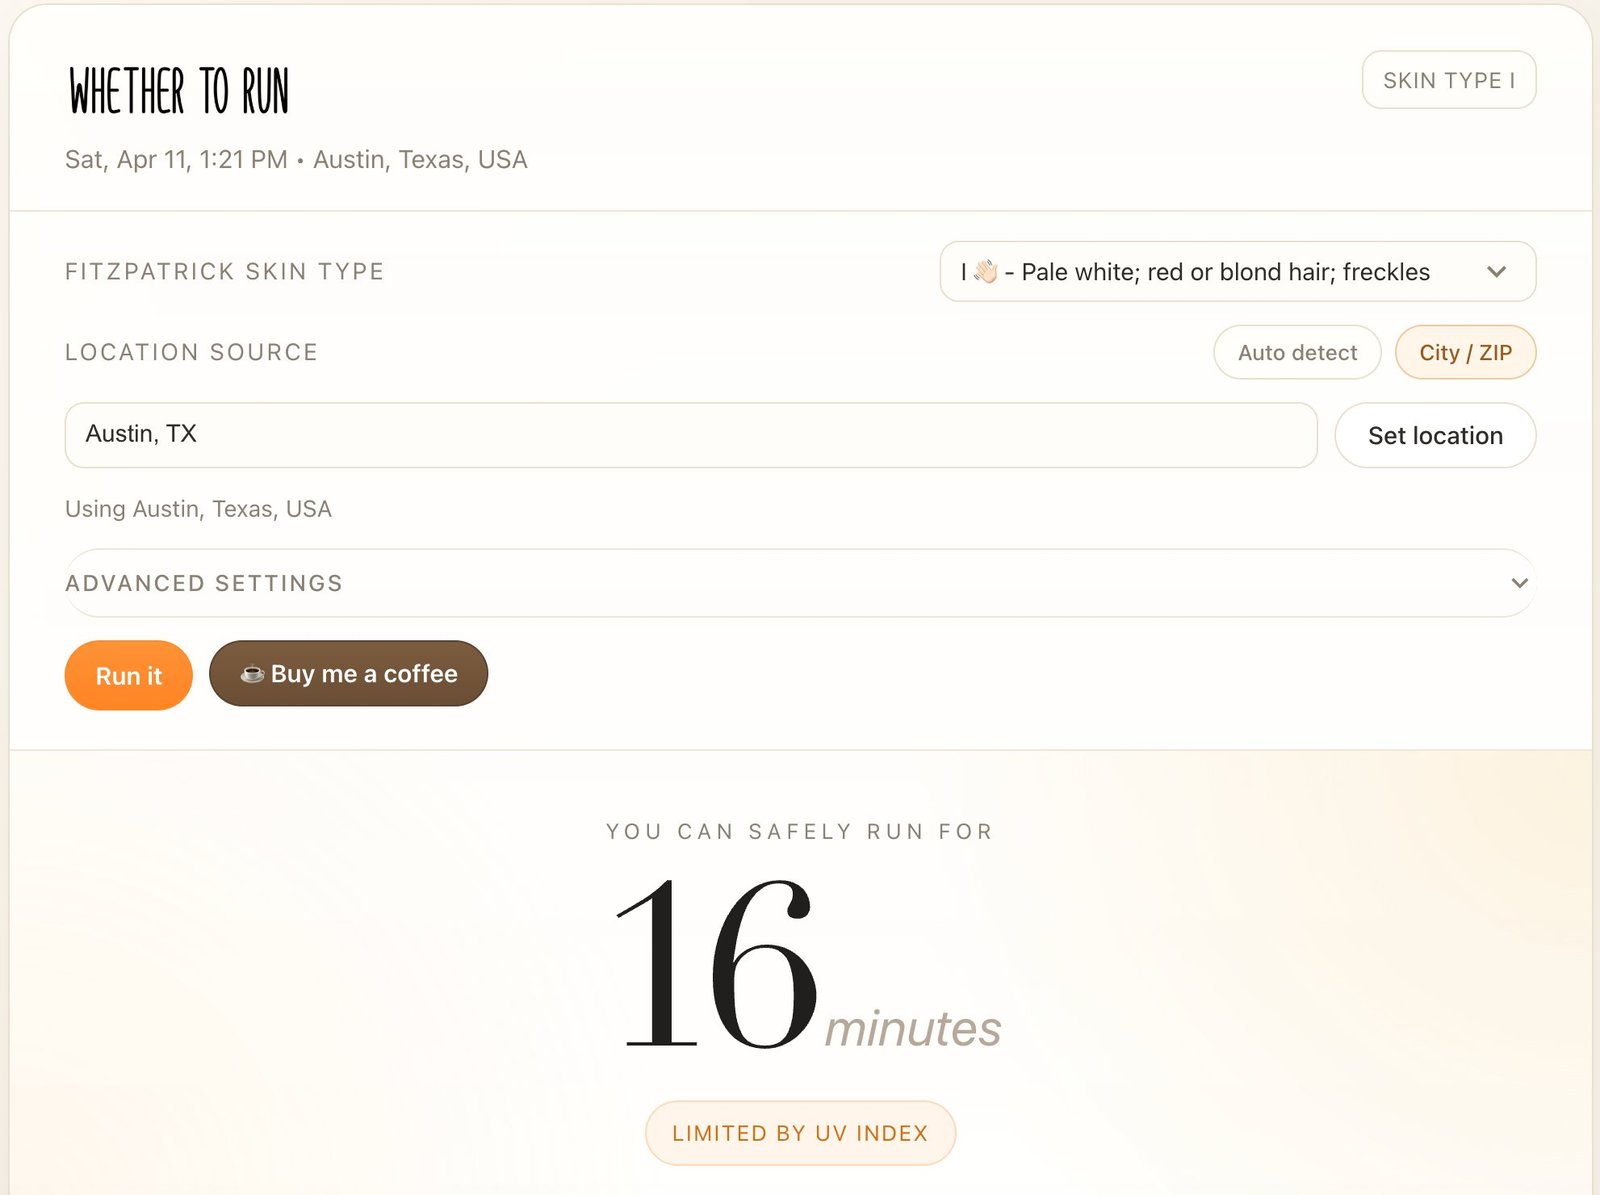
UV / Sunburn
Time to burn based on UV index and skin type. No sunscreen assumed.
Heat Exhaustion
WBGT-approximated risk using ACSM guidelines. Calibrated to recreational runners.
Frostbite
Windchill-based exposure time from NWS 2001 chart. Runner speed adds ~3 mph to wind.
Thunderstorms
If lightning is present, the app tells you not to run. Full stop.
Cold and windchill
For frostbite risk, the relevant metric is windchill — the "feels like" temperature on exposed skin — a combination of ambient temperature and wind speed measuring how quickly heat is lost from the body.
Wind and running direction matter more than you'd think. If the wind is 6 mph and you're running into it at 6 mph, your effective wind experience doubles to 12 mph. I've handled this with a compromise: adding +3 mph to the ambient wind reading. It's a crude approximation — I'd need to know wind changes during your run, terrain (buildings cut wind), and your running direction over time to do this precisely. My estimate is this reduces time-estimate accuracy by about 20% on average, more on calm days.[4]
Forecasting ahead: the 48-hour lookahead
One of the core problems with checking weather conditions at a single point in time is obvious the moment you think about it: conditions change. The app originally told you how long you could run given what the weather looked like right now — but if a storm was rolling in at hour two, you'd have no idea. You'd get a confident "you can run for 3 hours" on a morning that was about to turn dangerous.
This bothered me enough that I built a lookahead feature. The app now evaluates weather conditions across a rolling 48-hour forecast window and adjusts your recommended run time dynamically. If UV spikes at 11am, if heat index crosses a risk threshold at mile four, or if a thunderstorm appears in the forecast, the recommendation accounts for it. The constraint that binds is whichever hazard hits first in the forecast — not just what's happening when you open the app.
The implementation leans on the same WBGT approximation and NWS windchill lookups described above, just applied across hourly forecast slices rather than a single current reading. The tricky part is that the forecast data resolution degrades past about 12 hours — you're working with less granular model output — so confidence intervals widen. I handle this conservatively: when forecast uncertainty is high, the app errs toward a shorter recommended window rather than a longer one. Better to turn around early than to get caught out.
Questions for you:
Is there any other data that you're not getting from this that you'd like to see prominently displayed?
Any recommendations for UI/UX improvements?
I've recently started looking into how much running is too much (using ACWR and the like), so let me know if you'd like a product that syncs with your Strava to tell you if you're in danger of overtraining.
Questions, feedback, or a good weather story? Write me at .
— John Loughrin
If you like the app and would like to donate — I appreciate it.
Citations
- Henderson S, Javorniczky J, Gies P. "Spectral measurements of solar UV at several altitudes under Australian conditions." UV Radiation and its Effects, NIWA Research Workshop Queenstown, New Zealand. 2010.
- CDC/NIOSH. Criteria for a Recommended Standard: Occupational Exposure to Heat and Hot Environments. Appendix A, p. 149. 2016.
- Convertino et al., "ACSM Position Stand: Exercise and Fluid Replacement," Medicine & Science in Sports & Exercise, 1996. Via rrm.com.
- National Weather Service. Wind Chill Chart. 2001.